7 things you should know about GHG emissions related to hydropower & reservoirs
 

Hydropower has been a reliable and a critical tool in the fight against climate change, and in achieving national and international objectives towards reducing greenhouse gas (GHG) emissions. This is particularly true in the developing world where untapped sources of hydropower remain important[1]. Yet, the use of this energy is not without controversy, especially when it comes to GHGs. What is the current state of hydropower and what are the benefits? How does it contribute to sustainable development? Where are hydropower-related emissions coming from and how can they be calculated and monetised?

While hydropower newly installed capacities have been increasing since 2001, they are not on track for longer term sustainable targets. Hydropower can be considered a low-carbon source of energy but hydroelectrical plants with large reservoirs relative to their generating capacity can emit at least as much GHG emissions as fossil fuel plants[2]. These emissions mostly stem from reservoirs as well as construction and decommissioning. Despite the uncertainty to account for these, the use of the G-Res tool can help assess these. Under certain conditions hydropower projects are eligible for carbon finance.

Hydropower is still growing

Hydropower is the first source of renewable electricity. Its contribution to global renewable electricity production has been rising steadily since 2001. The International Hydropower Association (IHA) reported that, worldwide, more than 21.8 gigawatts (GW) of renewable hydroelectric capacity was put into operation in 2018. This is equivalent to the total electrical capacity of Chile or Belgium[3].

In 2018, China added the most capacity with 8,540 megawatts (MW), followed by Brazil (3,866 MW), Pakistan (2,487 MW), Turkey (1,085 MW), Angola (668 MW), Tajikistan (605 MW), Ecuador (556 MW), India (535 MW), Norway (419 MW) and Canada (401 MW). The allocation by country and region is presented in the figure below.

Hydropower installed capacity worldwide in 2018[4]

Hydropower annual capacity worldwide.png

According to the International Energy Agency (IEA), over the next five years, hydropower capacity should increase by 9%, led by China, India and Brazil.

To illustrate the disparity of potential and implementation, the Democratic Republic of Congo which has 35% of the whole African continent potential (i.e. 100 GW) only has 2.6 GW installed, not even enough to merit a position on the above chart.

The unlimited benefits of hydro

All in all, countries, in particular those of the developing world, expect hydropower to make a significant contribution to the United Nations Sustainable Development Goals[5], in particular by enabling them to limit, or even reduce their levels of GHG emissions stemming from electricity generation activities. Hydropower is thus expected to help deliver affordable and clean energy, manage freshwater, combat climate change and improve livelihoods.

Power-related benefits include clean and flexible generation and storage, as well as reduced dependence on fossil fuels and avoidance of pollutants. In terms of livelihood, benefits also include economic and local supply chain improvements, enhanced navigation and transportation, and investment in community services. Freshwater management benefits include supply for homes, industry and agriculture, and mitigation against floods and drought[6].

Hydropower benefits.jpg

Hydropower could provide for a broad range of benefits, and not only on-demand clean electricity.

Hydropower is needed for sustainable development

Needless to say, hydropower could play its part in reaching the objective of limiting climate change to 1.5°C or 2°C. In terms of adaptation, hydropower projects may offer countries protection against the impacts of climate change and extreme weather (e.g. floods or drought), even though variable climate conditions also make these projects susceptible to climate risks due to their dependency on precipitation and runoff.

According to the IEA, a continuous growth in new-build capacity is required to maintain an average generation increase of 2.5% per year through 2030 to remain on track with the Sustainable Development Scenario (SDS)[7]. As shown in the figure below, although growth prospects for new hydropower capacity remain strong, they are not sufficient to reach the SDS[8] level.

Hydropower generation in the Sustainable Development Scenario, 2000-2030

 
Hydropower generation in the Sustainable Development Scenario, 2000-2030.png
 

Yet, hydropower still contributes heavily to global emissions reduction efforts. As of March 2020, hydropower projects represented a staggering 24% of all carbon projects certified under the UNFCCC Clean Development Mechanism (CDM). It was as such, the most important category of project under the CDM[9].

The problem of hydropower GHG emissions

Hydropower is generally considered as a low-carbon technology and can act as a balance to the carbon- and pollutant-intensive fossil fuels. If hydropower was replaced with burning coal, up to 4 billion tonnes of additional GHG emissions would be emitted per year and global emissions from fossil fuels and industry would be at least 10% higher[10]. According to the Intergovernmental Panel on Climate Change (IPCC) and IHA, the median lifecycle carbon equivalent intensity of hydropower stands at 18.5 gCO2e per kWh, and only onshore wind would do better as can be seen in the figure below.

Carbon intensity of hydropower vs other technologies

Carbon intensity of hydropower vs other technologies.png

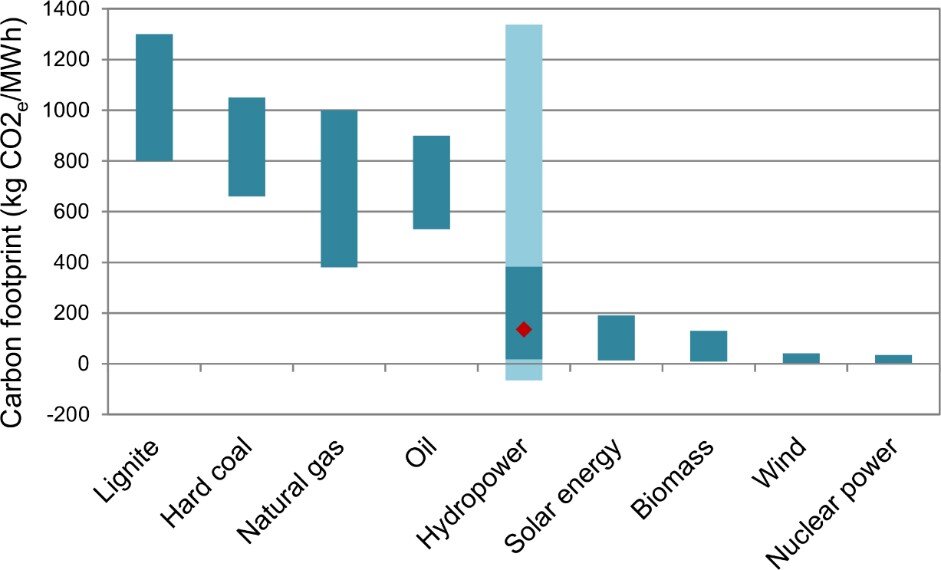
When looking at the variation of emissions for each technology, we realise that hydropower is the technology that features the greatest range of emissions. It could either be the least, or the most, carbon-intensive technology[11].

Carbon footprint variation of energy sources

Carbon footprint variation of energy sources.jpg

Run-of-river hydropower installations primarily use the natural flow rate of water to generate power, as opposed to the power of water falling with large dams with reservoirs. They tend to have very low levels of GHG emissions and have limited environmental and social impacts on local ecosystems and communities.

Reservoirs are the source of its problem

We have determined that the following parameters have a critical effect on the final emission level (ranked from most to least impacting):

  • Average temperature (more generally local climate and variations, including precipitation and wind velocity impacting to a lesser extent)

  • Size of reservoir versus the installed capacity (more generally the dam’s physical characteristics)

  • Services assigned to the reservoir (which would act on the allocation of emissions to activities other than electricity generation)

  • Cumulated mean horizontal solar radiance

  • Reservoir volume (as a function of depth and surface)

  • Land use patterns (including population levels) in catchment area/reservoir area pre- and post- impoundment as well as size of catchment area

  • Other factors such as soil carbon content (in the reservoir) and other biophysical characteristics of the catchment area, including fauna and flora characteristics and canopy cover

Interactions between these parameters are often complex and involve non-linear responses. Emissions stemming from these interactions are as such difficult to predict and estimate with precision.

Depending on the decommissioning method used, there may be secondary emissions from the carbon sink that are created when the reservoir is dried up.

Emissions of carbon dioxide (CO2), methane (CH4) and nitrous oxide (N2O) are part of the biogeochemical cycles of carbon and nitrogen from water bodies in natural environments. Hence, local emissions may be altered in areas affected by the development of reservoirs used for hydropower, flood control, drinking water, irrigation, navigation or other water uses[12].

GHG emissions from reservoirs generally stem from:

  • The decomposition of organic matter flooded by the reservoir and the biomass that grows and enters the reservoir as inflow during the life cycle. Emissions from flooded lands can occur through the following pathways after flooding: (1) molecular diffusion across the air-water interface (diffusive emissions); (2) CH4 bubbles from sediment (bubble emissions); (3) emissions resulting from the passage of water through a turbine and/or through the weir and downstream turbulence (degassing emissions); and (4) emissions from the decomposition of above-ground biomass

  • Construction, operation and dismantling activities.

Human activities in the catchment area or reservoir can also influence water quality and thus the eutrophication of water bodies and therefore create conditions for increased methane formation.

In tropical and subtropical areas, CH4 emissions are minimised in winter and maximised in summer and the decomposition of above-ground biomass (i.e. the biomass of trees not submerged during flooding) can be an important source of emissions.

The emissivity level is generally considered to be relatively high during the first few years after flooding, up to the first 10 to 20 years as can be seen in the figure below representing emissions from an Andean dam. Recent studies suggest that CO2 emissions during the first 10 years after flooding are the result of the decomposition of organic matter in the field prior to this event, while subsequent CO2 emissions come from material transferred to the flooded area[13].

Typical emissions pattern from reservoirs[14]

Typical emissions pattern from reservoirs.png

Finally, the issue of climate change must also be considered, as a feedback loop. An average increase in mean annual temperature in tropical and subtropical regions, as is predicted under both the 1.5°C and 2°C warming pathway for sub-Saharan Africa[15], could lead to increased emissions from reservoirs.

Calculation of GHG emissions

The IHA, along with the United Nations Educational, Scientific and Cultural Organization (UNESCO) developed a freely accessible GHG emissions calculation tool to quantify the portion of GHG emissions that can be attributed to the creation and operation of a hydroelectrical reservoir: the G-Res tool[16]. The use of this tool is recommended by the IEA, IAH, UNESCO and the World Bank to perform such a calculation.

However, since the G-Res tool is only as precise as the data entered into it, it is worth considering the IPCC-recommended three-tier approach in selecting data used to calculate emissions. Tier 1 is based on general estimation drawn from secondary data. Tier 2 is based on regional data, drawn from secondary bibliographical sources, while Tier 3 is drawn directly from primary data, collected in the field.

Using the G-Res tool is a relatively complex process. All the parameters described above are accounted for by the tool as inputs. Most need to be entered manually by the user. Some can be calculated using the tool’s database (the earth engine). For others, standardised values taken from the same database, can also be used.

As can be seen in the figure below, the tool offers a complete solution to calculate emissions from a dam/reservoir over a period of 100 years. Natural and man-made emissions from the catchment area, from the reservoir, as well as those produced in the construction phase are processed to give a full picture of a project’s GHG emissions, with a 95% confidence level.

Users are also given the possibility of comparing their results with those of equivalent dams/reservoirs. Values for emission factors are standardised but can be modified if necessary.

In order to get an accurate estimate, it is necessary to know with precision how to enter each parameter in the tool and field data.

Finally, the tool remains imprecise when it comes to calculating emissions for complex hydroelectrical installations, such as cascade dams.

G-res Tool web interface

G-res Tool web interface

Certifying emission reductions from hydropower

The cost of hydropower can be high but remains overall in the fossil fuel cost range or below as can be seen in the figure below. In many developing countries, the investment and institutional environment can make infrastructure projects unattractive to investors.

One way of facilitating and encouraging contributions from hydropower to global emission reductions objectives is by certifying and monetising the emission reductions to increase their investment profile, notably through a better return on investment and risk reduction.

Global levelised cost of electricity from utility-scale renewable power generation technologies

Global levelised cost of electricity from utility-scale renewable power generation technologies.jpg

Certifying emission reductions stemming from hydroelectricity entails starting with finding the appropriate standard and emissions reduction methodology.

Because of uncertainties surrounding the emissions levels of hydropower, the CDM’s Executive Board excluded projects with a power density below 4 watts per m2 of reservoir surface (e.g. a very large reservoir in relation to the capacity installed) from being eligible to existing calculation methodologies. For similar reasons, projects with installed capacity that are over 15 MW (for the Verified Carbon Standard - VCS) and 20 MW (for the GS4GG) are not eligible to certification. The graph below shows the lower the power density, the higher the emission per unit of electricity produced, especially in tropical and sub-tropical areas.

Power density vs emission intensity[17]

Power density vs emission intensity.png

Only those projects avoiding further emissions and requiring the financial revenues to be financially viable could benefit from international carbon finance.

How HAMERKOP can support

HAMERKOP Climate Impacts has worked with the European Union and other institutional clients in assessing emission levels and estimating emission reduction potential for several hydroelectrical installations in West Africa.

We hold the necessary expertise to help prospective developers assess, estimate and determine emissions from their future and present hydroelectric projects.

We can also evaluate the feasibility of certifying your project to carbon certification standards to allow them to benefit from their full economic value, by enabling selling of carbon credits on the voluntary or compliance carbon markets.

Under the Paris Agreement, the international cooperation mechanisms under article 6 could help you benefit from international climate finance and we can help you assess and set-up a strategy to achieve this.

SOURCES

[1] IHA (2019) Hydropower Status Report: https://www.hydropower.org/statusreport

[2] International Rivers (2019) Reservoir Emissions: https://www.internationalrivers.org/campaigns/reservoir-emissions

[3] CIA (2017) The World Factbook. Electricity, installed generating capacity is the total capacity of currently installed generators: https://www.cia.gov/library/publications/the-world-factbook/rankorder/2236rank.html

[4] IHA (2019) Hydropower Status Report: https://www.hydropower.org/statusreport

[5] IHA (2015). Sustainable Development Goals: how does hydropower fit in? https://www.hydropower.org/blog/sustainable-development-goals-how-does-hydropower-fit-in

[6] IHA (2019). Hydropower Status Report: Sector Trends and Insights: https://www.hydropower.org/sites/default/files/publications-docs/2019_hydropower_status_report_0.pdf

[7] IEA (2019) Tracking Power : https://www.iea.org/fuels-and-technologies/hydropower

[8] The IEA’s Sustainable Development Scenario (SDS) outlines a major transformation of the global energy system, showing how the world can change course to deliver on the three main energy-related SDGs simultaneously, by 2050 (SDG 7, SDG 3 & SDG 13). The SDS holds the temperature rise to below 1.8°C with a 66% probability without reliance on global net-negative CO2 emissions; this is equivalent to limiting the temperature rise to 1.65°C with a 50% probability. IEA (2019) SDS: https://www.iea.org/reports/world-energy-model/sustainable-development-scenario

[9] IGES (2020) IGES CDM Project Database: https://www.iges.or.jp/en/pub/iges-cdm-project-database/en

[10] IHA (2019) Hydropower Status Report: Sector Trends and Insights: https://www.hydropower.org/sites/default/files/publications-docs/2019_hydropower_status_report_0.pdf

[11] Sherer, L., Pfister, S., (2016). Hydropower's Biogenic Carbon Footprint. PLOS ONE., 11(9). P. 11: https://doi.org/10.1371/journal.pone.0161947.

[12] IEA (2018) Hydropower Annex XII: Guidelines for Quantitative Analysis of Net GHG Emissions from reservoirs – Volume 3: Management, Mitigation and Allocation.

[13] IPCC (2019). IPCC Good Practice Guidance for LULUCF 3.285; Chapter 3: LUCF Sector Good Practice Guidance

[14] Forsberg BR, Melack JM, Dunne T, Barthem RB, Goulding M, Paiva RCD, et al. (2017) The potential impact of new Andean dams on Amazon fluvial ecosystems. PLoS ONE 12(8): e0182254. https://doi.org/10.1371/journal.pone.0182254

[15] IPCC (2019). IPCC Good Practice Guidance for LULUCF 3.285; Chapter 3: LUCF Sector Good Practice Guidance

[16] UNESCO/IHA research project on the GHG status of freshwater reservoirs (2017). The GHG Reservoir Tool (G-res) Technical Documentation.

[17] IHA (2018). Study shows hydropower’s greenhouse gas footprint: https://www.hydropower.org/news/study-shows-hydropower’s-carbon-footprint

 
Olivier Levallois
The 4 learnings from the 1st report of France's High Council on Climate Change
 
ClimateMarch.jpg


I am in this post exploring the first report of France’s High Council on Climate Change published on June 17th, 2019.

The High Council is an independent body created by the decree of 14 May 2019 to issue opinions and recommendations on the implementation of public policies and measures to reduce France's greenhouse gas emissions, in line with its international commitments, in particular the Paris Agreement and the achievement of carbon neutrality in 2050. It is chaired by French-Canadian climate scientist Corinne Le Quéré and composed of ten members chosen for their expertise in the fields of climate science, economics, agronomy and energy transition.

Point #1 – Not all carbon neutrality claims are equal

Facing political resistance from some parties, governments are committing their countries to carbon neutrality at different horizons (Norway in 2030; Sweden in 2045; France, UK, New Zealand in 2050), but these may mean extremely different things for each of them.

Everyone should keep them in check and make sure the gap between “what it sounds like” and “what it actually is” is not too large.

Factors influencing this:

✔️ Inclusion of Greenhouse gas emissions (CO2 vs CO2+CH4+N2O)

✔️ Scope of emissions (e.g. inclusion of international transportation - flights and maritime) and imports (e.g. embedded carbon of products consumed in a country)

✔️ Use of international credits (i.e. possibility to outsource emission reductions)

The recently published report of the French committee on climate change in charge of keeping check of the government progress in terms of climate change makes a useful read in this regard.

Point #2 - Carbon border tax regulation can be used to avoid environmental dumping!

According to the first report of the French committee on climate change, French’s people carbon footprint has increased by 20% since 1995.

Even though domestic emissions have decreased by 20%, what happened is that emission related to imported have doubled Since 1995 and keep increasing. 🚛

🥐 In 2015, a French person carbon footprint was 11 tCO2e, including 6,6t CO2e domestically and 4.4% generated abroad.

Proposals for carbon border tax regulation makes sense in this context: avoid environmental dumping! Hence the environmental outcry over the free trade agreement with Mercosur.


Point #3 - In France, funding for climate-damaging activities remained higher than that of climate-friendly activities. Always consider one amount from the perspective of another.

In 2018, climate-damaging investments were almost twice as high as climate-friendly ones.

👎 While "climate investments" (public and private) increased over the period of the first carbon budget (2015-2018) to reach €41.4 billion in 2018, climate-damaging investments reached €75 billion (in 2017), stagnating over the last few years.

Positive investments: buildings (€20.7 billion), transport (€12.7 billion), energy (€6.7 billion), industry (€1 billion) and agriculture (€0.4 billion).

Negative investments: mainly from the purchase of fossil fuels powered vehicles.

According to OECD, fossil fuel subsidies in France have more than doubled in 10 years, from less than €3 billion in 2007 to €6 billion in 2017.

Point #4 – The social dimension of climate change is at least as important as the scientific one.

The challenges to overcome are the ones of resources, social equity and education:

✔️ Poor management of the transition to a lower-carbon economy will penalise lower-income households, leading to protests and unproductive actions (e.g. a carbon tax will penalise fossil fuel heating system owners). The yellow vests movement has illustrated this with colours;

✔️ The social dimension is much more challenging to track and very few indicators are being tracked;

✔️ In France, 23% of people do not believe climate change is real; 36% of 18-24 years old people;

✔️ In France, 12% of 18-24 years old people are not willing to make any effort to avoid climate change to worsen;

✔️ Since mitigation has not been ambitious enough, climate change adaptation (actions taken to manage impacts of the change by reducing vulnerability and exposure to its harmful effects) has to be integrated to policies.


Report: Agir en cohérence avec les ambitions, High Committee on Climate Change. 2019.

Link: https://www.strategie.gouv.fr/sites/strategie.gouv.fr/files/atoms/files/hcc_rapport_annuel_2019.pdf

 
Financing climate resilience, the hidden challenge
 
ClimateResilient.jpg


With climate change set to have numerous physical impacts upon our world, it is important to ensure resilience at national, company and individual levels. Climate resilience was identified as the main issues at the 2019 United Nations Environmental Programme Finance Initiative (UNEP FI) Regional Roundtable for Africa and the Middle East.

Resilience is defined as ‘the capacity to recover quickly from difficulty’. Climate change presents us with countless difficulties, some already present and others, more difficult to predict, that will emerge and continue to worsen as average global temperatures rise in the future.

With $90 trillion of investment in climate projects needed by 2030[1], it is now more than ever that financial resilience and investment into resilient infrastructure must be developed.

Whilst in Cairo, we have attended this event, a small overlapping world of climate change and finance professionals. This post summarises the main discussion topics and issues surrounding the tools and solutions currently available to the public and private sector to build climate resilience at various levels.

Planning for resilient infrastructure

Financial investments into infrastructure in emerging markets are set to play a crucial role in building resilience, as infrastructure is designed to last decades. It is said that if infrastructure is to keep up with economic development, $3.3 trillion[2] of investments will be required per annum. This therefore means that partnership between governments and private businesses must occur to not only spread costs but also risks. If planned and implemented correctly, new infrastructure can be built to withstand future changes to the global climate. However, it is crucial that this should be done by focusing on what these changes to the climate will be imply and be like, as opposed to modelling and analysing historic data to predict the future when planning for new infrastructures and assessing the impact on existing ones.

The Organisation for Economic Co-operation and Development (OECD) analysis of flooding in Paris found that as much as 55% of the direct flood damages would impact the infrastructure sector[3]. Had future climate and flooding been modelled, the impact of the flooding could have been anticipated and reduced. There must therefore be both retrofitting and future planning for new infrastructure put in place to minimise the impacts of climate change upon society, building resilience for communities, companies and countries.

Another example could apply to new housing developments built upon flood plains. These should include buffer zones to mitigate and adapt to the changes in future water flow. Adding in vegetation, natural ponds and small hills can absorb the energy from tidal waves, reduce the amount of water reaching the infrastructure and thus reducing impact upon the area. It is an added bonus that it also adds aesthetic value! Further, modelling future climate increases the longevity of the infrastructure. For example, when building a dam historic river flow data is used when in fact future water flow should be analysed, as climate change will impact the quantities of water that will reach the dam.

Whilst these suggestions may require extra work due to the complexities of climate modelling, data collection/interpretation, infrastructure planning and space requirements, they should not be ignored. Current infrastructure systems were built over a period of decades and were not designed for either the current/future technological developments nor the changes to the climate. Due to the potential limitations this can have upon future societies, climate scenario analysis must be undergone and fully understood prior to design implementation.

Building resilient financial markets

Considering the scale of investments required, the financial sector needs to be on board. Banks and investors pursuing a different strategy will be exposed to significant and systemic risk of failure. According to William Martindale from Principles on Responsible Investment, there is now approximately 400 climate change-related pieces of legislation and initiatives for the financial sector worldwide, 50% of which have come live over the past 3 years. Here is a small number of established and emerging initiatives that have the potential to have a significant impact over time:

  • Principles on Responsible Investment (PRI): in order for investment companies to holistically report, track and consider the Environmental, Social and Governance (ESG) impacts of their investment. Backed by the United Nations (UN), the Principles ask signatories to incorporate, disclose and actively work to reduce any ESG issues faced by investments made. Through doing so, it is hoped that the market will build resilience as well as consumer knowledge of the risks faced by various sectors investments may be held in.

  • Principles for Responsible Banking: under development at the time of this post, 26 leading banks representing USD 16 trillion in assets are re-defining banks’ purpose and business model to align the sector with the UN Sustainable Development Goals (SDGs) and the Paris Climate Agreement. The Banking Principles are expected to direct banks’ efforts to align with society’s goals (SDGs, Paris Agreement, national and regional frameworks) through goal setting, reporting on their contribution to national and international social, environmental and economic targets, ensuring accountability and transparency on their impacts and challenging the banking industry to play a leading role in creating a more sustainable future.

  • The Sustainable Stock Exchange Initiative (SSEI): initiated in 2009 and supported by a range of UN agencies, the International Organization of Securities Commissions and others, the SSEI aims to further the availability of sustainable and climate-robust investment opportunities. It does so notably through forums that support stock exchanges’ sustainability-related activities and bring capital market players together to identify, discuss and take collective actions on common sustainability issues relevant to their region or globally.

  • The Sustainable Banking Network (SBN): facilitated by the International Finance Corporation, SBN is a community of financial sector regulatory agencies and banking associations from emerging markets committed to advancing sustainable finance in line with international good practice. Launched in 2012, the SBN facilitates the collective learning of members and supports them in policy development and related initiatives to create drivers for sustainable finance in their home countries. It promotes 3 pillars: environmental and social risk management, green financial products and services and eco-efficiency.

However, most of these initiatives are voluntary mechanisms that have not always proven to provide enough incentives to be fully adopted or trigger change at scale. While creating awareness is essential to get the market to initiate a shift, policy-makers have a pivotal role to play to ensure the entire market is getting up to speed. A better case needs to be made for “sustainable investment”. The chairman of the Egyptian Financial Regulatory Authority, Dr Mohammed Omran, has for instance mentioned that the ESG index in Egypt has over the past 6 years been the best performing index of the stock exchange. If that really was the case, we should soon see a surge of investors towards sustainable investments.

Deep integration of environmental and investment specialists is required to align investments, climate change, mitigation, adaptation and climate resilience. This will allow further the development of low-carbon and climate resilient instruments at an international level.

Sustainable investments and the need of complementary expertise

Many companies offer ‘Green’ or ‘Sustainable’ trackers which you can select from. However, the lack of homogeneous definition for sustainable investments means that there is no market consensus on what is a low-carbon or a climate-resilient investment. In addition, the green or sustainable attributes are often used for low-carbon investment rather than for climate resilient ones. There is also the risk of existing investments being ‘green-washed’ – making the investment appear more sustainable than they are, diverting funding from robust activities. Collaboration and integration of financial, environmental and social experts is needed to ensure that the market become more resilient and consistent.

In order for low-carbon and climate resilience investments to grow in a high-quality manner, systemic market changes must take place. With the investments required to achieve the UN SDGs, as well as to keep up with economic development, corporate investment must run alongside public investment. This would not only spread costs but also the risks involved – neither can fund the requirements alone. Whilst this will take work, collaboration and numerous experts, there must be public-private partnerships for future projects to be resilient to climate change.

While currently serving low-carbon investment rather than climate resilient ones, Green Bonds are one of the private sector solutions that can contribute in achieving sustainable growth and climate change resilience. They are loans which fund environmentally friendly and sustainable projects only. 2018 saw the largest amount invested into Green Bonds ever seen, with a record $389bn[4] loaned. Nevertheless, green bonds have been slow to take off in developing nations due to a lack of clearly defined asset classes, market standards and secure transactions.

The Adaptation Benefit Mechanism is one of the instruments under development by the African Development Bank to foster result-based payments investment into adaptation and could play an important role in meeting the Paris Agreement adaptation objectives. For instance, a project developer may get paid $50 per farmer it makes climate-resilient. Payment would be made by the investors (e.g. a commodity trader) once it has been demonstrated it has succeeded.

Resilience for the poor - the role of FinTech

In developing countries, financial Technology (“FinTech”) has the potential to act as a corridor towards sustainable and resilient development for personal, corporate and government bodies.

FinTech can provide easy access to both finances and financial information. For example, online banking through a mobile device can free up time previously spent queuing at the bank, increasing available time for economic generating activities, social care or education. This can therefore build and promote climate resilience for individuals.

It works also for companies and governments, as innovative technologies such as blockchain can process and manage complex multi-national transactions in a secure and audited platform. This can aid financing solutions for infrastructure projects, green bonds and other financial instruments required to bridge the funding gap for climate resilience.

This development requires innovation from both the technology and finance industries as well as collaboration between the two to form new products that can solve future issues generated by climate change.

In order to sustainably develop, mitigate and adapt to climate change, financial resources and physical infrastructure are required beyond that which governments alone can provide. We must therefore see partnership between public and private sectors to balance costs and risks as well as to grow economies sustainably.

Identifying issues with business resilience through risk analysis can be one way of taking an active step towards reducing pressures of climate change on your business. There are various voluntary reporting metrics which ask for companies to disclose these risks either publicly or privately such as the Climate Disclosure Project (CDP) and the Dow Jones Sustainability Index (DJSI). One framework soon to become compulsory is the Task Force on Climate-Related Financial Disclosure (TCFD) which provides a reporting methodology. This can be used to aid understanding and calculation of the risks posed by climate change and your business’s resilience.

[1] https://www.climatebonds.net/cbi/pub/data/bonds

[2] UNEP FI 2019

[3] http://www.oecd.org/environment/cc/policy-perspectives-climate-resilient-infrastructure.pdf

[4] https://www.climatebonds.net/files/reports/cbi_sotm_2018_final_01k-web.pdf